May 13, 2020
Is Greenland Okay?

By: burgundy bug

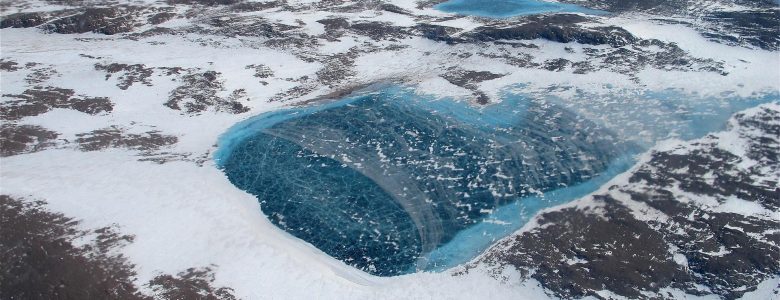
Frozen meltwater lake along the northeast Greenland coast, as seen from NASA’s P-3B aircraft on May 7, 2012. Credit: NASA/Jim Yungel
Source: NASA Images
Last year saw record-breaking ice melt events in Greenland, with the largest island on Earth yielding a net ice loss of over 300gt, according to the National Snow & Ice Data Center.
To put this into perspective, a gigatonne is 1,000,000,000 metric tons, and a metric ton is equal to 1.10231 US tons. 300gt is roughly 330.7 billion US tons. Here, try out the conversion for yourself. We’ll wait.
However, last year was only the seventh-worst year for ice melt in Greenland. Data from the NSIDC shows 2012 had the highest ice melt, but melt had significantly decreased by 2013 – that isn’t to say conditions weren’t a cause for concern, but they had “chilled out” in comparison to 2012.
So, is there a chance 2020 might spare a little mercy towards Greenland? Well…
The rate of melt is currently in a tug-o-war with annual snowfall, which is a prime opportunity for the ice sheets to recoup from their losses.
Yet, a new Science journal study reveals the ice sheets in Greenland and Antarctica are losing mass along the margins faster than snow is compiling in the interior.
In Greenland, surface meltwater runoff has lead to widespread thinning of its lower altitude regions. Additionally, tidewater glacier fronts thinning and retreating has led to accelerated water flow and discharge into the ocean.
If Greenland’s ice sheet melts, it has the potential to cause about a 23-foot sea-level rise. Antarctica’s ice sheet could cause approximately 190-feet in sea-level rise. Together, that’s 213-feet.
“Given the susceptibility of ice shelves and floating glacier termini to changing atmospheric and oceanic conditions, and of grounded ice to shrinking ice shelves, we can expect increasing contribution from both Greenland and Antarctica to sea level rise on relatively short (decadal to centennial) time scales,” the study concludes.
Grab your snorkels. We’re about to dive in to the fate of our oceans and coastal cities.
Current Ice Melt and Sea Level Rise Trends
“Observations from 11 satellite missions monitoring the Greenland and Antarctic ice sheets have revealed that the regions are losing ice six times faster than they were in the 1990s,” says a recent NASA article. “If the current melting trend continues, the regions will be on track to match the ‘worst-case’ scenario of the Intergovernmental Panel on Climate Change (IPCC) of an extra 6.7 inches (17 centimeters) of sea-level rise by 2100.”
Throughout the 1990s, Greenland and Antarctic ice sheets lost an average of 81 billion tons per year. By the 2010s, that average rate had increased to 475 billion tons per year, which is a sixfold upsurge.
“All total, Greenland and Antarctica have lost 6.4 trillion tons of ice since the 1990s.”
Greenland, Antarctica Melting Six Times Faster Than in the 1990s | NASA
This has contributed to a global sea-level rise of 0.7 inches, 60 percent of which resulted from ice loss in Greenland and 40 percent from Antarctica’s losses.
“Every centimeter of sea level rise leads to coastal flooding and coastal erosion, disrupting people’s lives around the planet,” University of Leeds professor of Earth observation Andrew Shepherd said to NASA.
The 2020 Outlook For Greenland
Researchers station in Greenland annually to conduct research on ice melt throughout the summer months, says the NSIDC. As of April 6, daily updates on Greenland’s Ice Sheet have resumed.
Although the summer season is still at the tip of the iceberg – err, ice sheet – the surface melt extent data is already teetering around the rates we saw in 2019 and 2012.

Greenland Surface Melt Extent: 2012 v.s. 2019 v.s. 2020
Source: Greenland Surface Melt Extent Interactive Chart | NSIDC
Peering into the Ice-Crystal Ball

“Greenland? Outlook not so good”
Source: The Burgundy Zine
Researchers are still uncertain about how fast these rates will continue to rise and how to predict the extent of its worldwide impact, according to a 2019 Journal of Geophysical Research review.
“Unfortunately, despite the rapid growth of interest in GrIS [Greenland Ice Sheet] mass loss and its impacts, we still lack the ability to confidently predict the rate of future mass loss and the full impacts of this mass loss on the globe,” the study says. “Uncertainty in GrIS mass loss projections in part stems from the nonlinear response of the ice sheet to climate forcing, with many processes at play that influence how mass is lost.”
All that can be said for certain is the Greenland ice sheet is melting. It is linked to warmer global and ocean temperatures. It is linked to high-pressure zones. And this does affect more than sea-level rise.
“Observations now indicate that the impact of a melting GrIS are more widespread than just sea‐level rise and include changes to ocean properties and circulation, nutrient and sediment cycling, and ecosystem function,” the JGR review continues.
Last year, NASA said continued ice melt in Greenland over the next 200 years could contribute to 63 inches of global sea level rise, with the island losing more than 99 percent of its ice sheet by 3000.
Last month, a Geophysical Research Letters study features a computer-simulated model that predicts the Arctic Ocean will become “practically ice-free” before 2050.
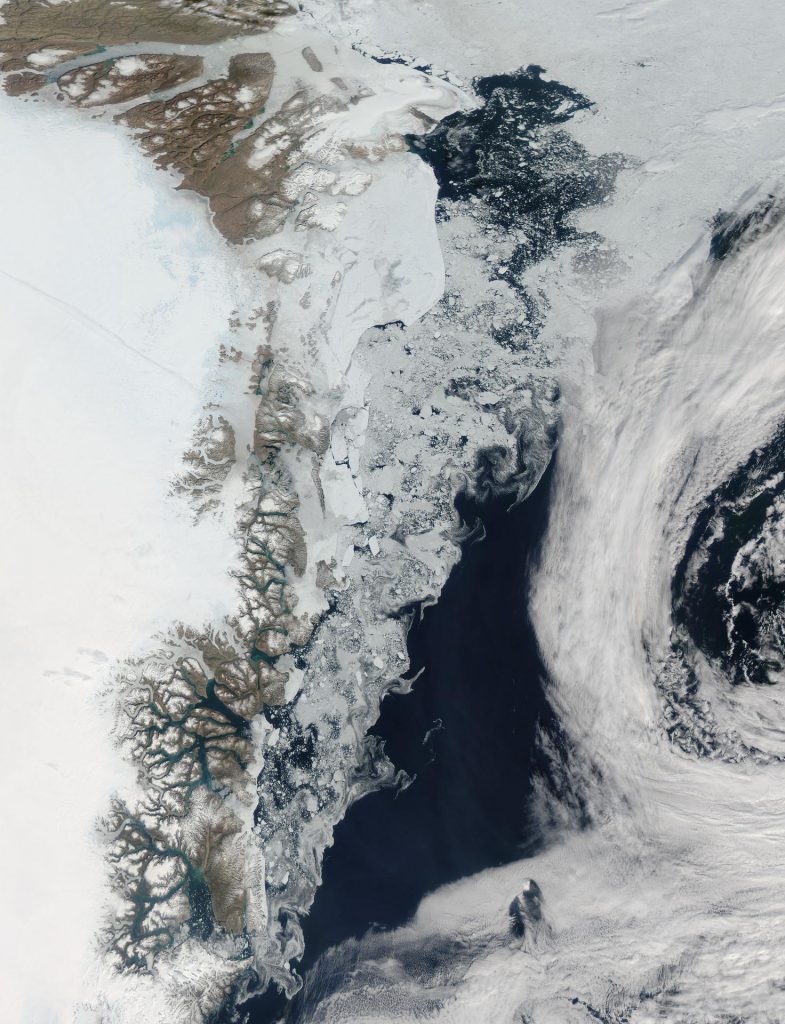
As the northern hemisphere experiences the heat of summer, ice moves and melts in the Arctic waters and the far northern lands surrounding it. The Moderate Resolution Imaging Spectroradiometer (MODIS) aboard NASA’s Aqua satellite captured this true-color image of sea ice off Greenland on July 16, 2015
Source: NASA Images
“For all scenarios, the first year of practically sea-ice-free conditions ranges from some years before present to the end of this century, with a clear majority of models reaching ice-free conditions before 2050,” the study says.
While sea-ice differs from ice sheets in that it forms from frozen ocean water and ice sheets accumulate from snowfall, these simulations provide additional insight into ocean water warming. As mentioned above, higher ocean temperatures contribute to higher rates of coastal ice sheet melt.
In Conclusion
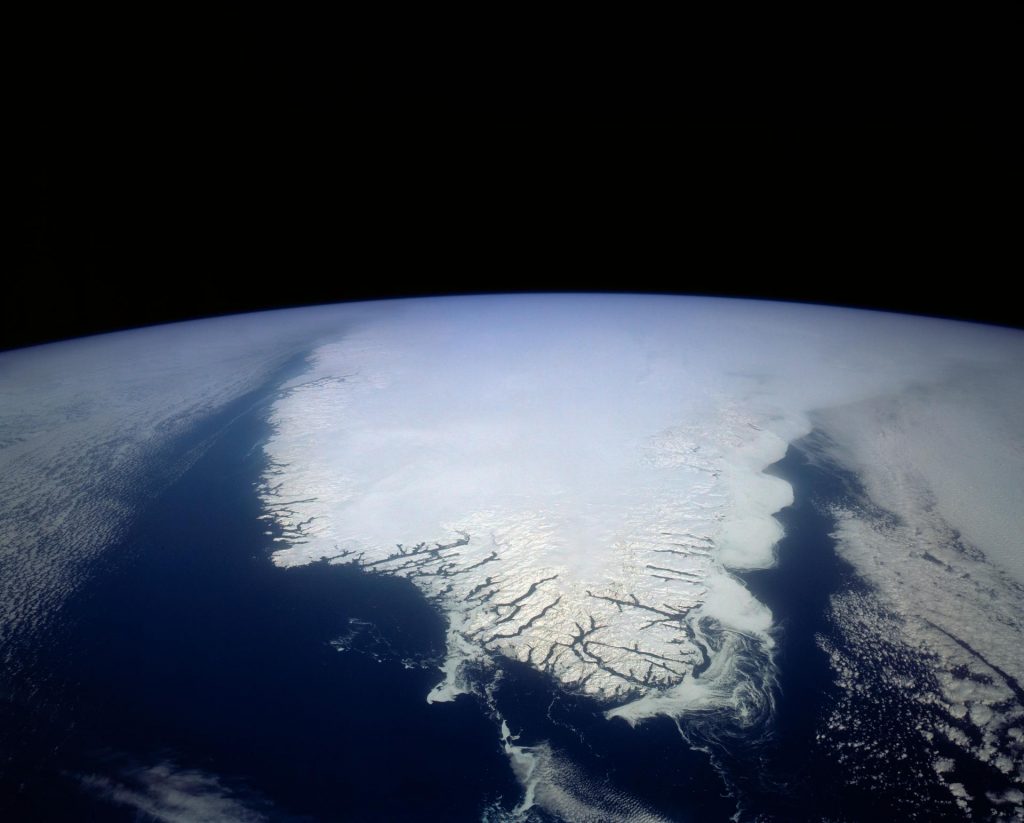
This spectacular north looking view of south Greenland (62.0N, 46.0W) shows numerous indentations along the coastline, many of which contain small settlements
Source: NASA Images
(Photo captured by NASA in April 1992)
In essence, we won’t know how this summer will contribute to ice melt in Greenland until it’s happening before our very eyes.
In any case, the latest predictions give us a glimpse into what might happen to the ice sheets if humanity continues on its environmentally destructive path.
Five human impacts on the environment
Source: 5 Human Impacts on the Environment: Crash Course Ecology #10 | Crash Course
While a unified effort to halt global warming could slow the rate of ice melt, the future still looks uncertain. But if nothing is done to try to save Greenland or Antarctica, it’s going to continue losing ice at alarmingly rapid rates.
For more information on Greenland, ice sheets, and the record-breaking melt events last year, continue reading our article, “What’s Beneath Greenland May Not Be so Green.”
Interested in having content featured in an upcoming blog post or issue of The Burgundy Zine? Head on over to the submissions page!
For all other inquiries, please fulfill a contact form.
burgundy bug
https://burgundyzine.com/about/#burgundybugA cynical optimist and mad scientist undercover, burgundy bug is the editor, graphic designer, webmaster, social media manager, and primary photographer for The Burgundy Zine. Entangled in a web of curiosity, burgundy bug’s work embodies a wide variety of topics including: neuroscience, psychology, ecology, biology, cannabis, reviews, fashion, entertainment, and politics. You can learn more about working with burgundy bug by visiting her portfolio website: burgundybug.com
View more posts from this author